
Step 1 of 7
Why did it move?
Every day you get a short explanation in plain words: the news, report or market behind the move.
Show the explanations →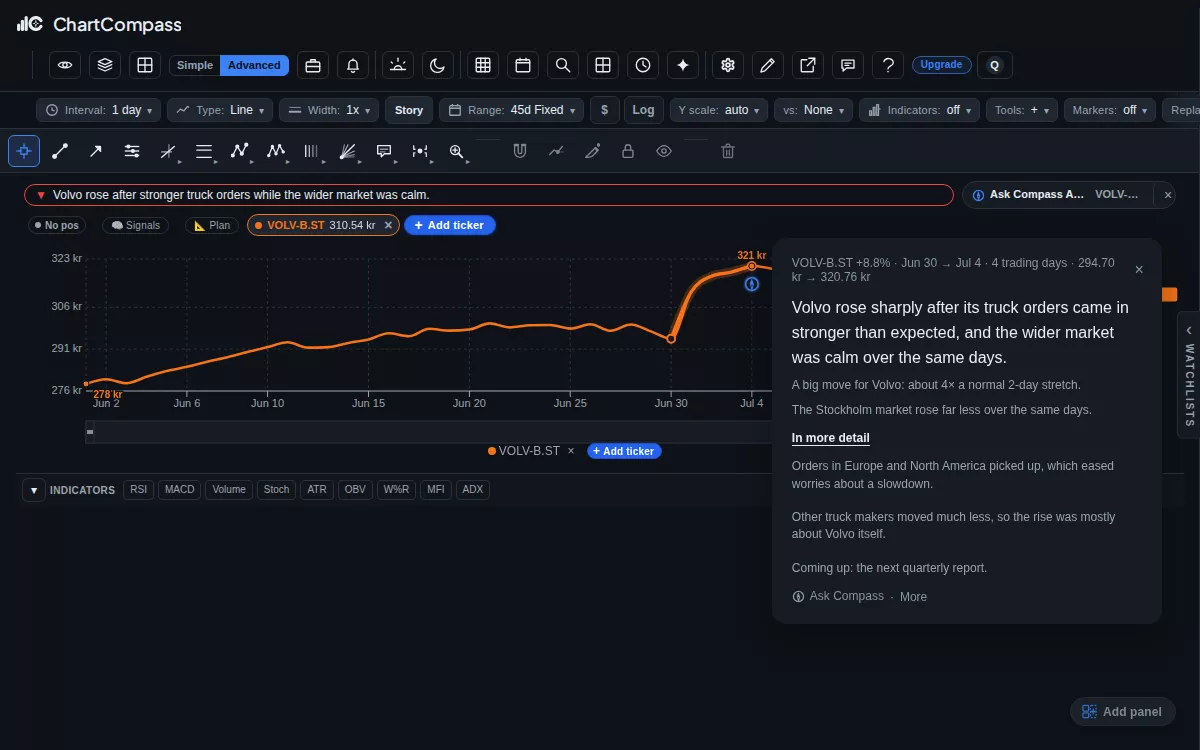
Type a company you own or follow — like Volvo, Ericsson or Tesla — and see what happened today, in plain words. Free, no account needed.
Volvo B · 1 month
Why it moved
Volvo B jumped 6.4% on the day of its quarterly report, when orders came in higher than expected. The Stockholm market rose 0.8% that day.
Every move in plain words: the news, report or market behind it.
Read more below ↓Averages that break, RSI, MACD and new yearly highs, marked on the chart.
Read more below ↓When price breaks a key level we show where and when.
Read more below ↓How the stock moved after similar moments before.
Read more below ↓Type a company you own or follow, in the Nordics or the US.
See how it works →ChartCompass looks at how the price moved, compares it with the market, and reads the news from those days.
See how it works →You get a short explanation in plain words. With Essential you can ask your own follow-up questions.
See how it works →Step 1 of 7
Every day you get a short explanation in plain words: the news, report or market behind the move.
Show the explanations →Step 2 of 7
Want to know more? Ask your own question about the company and get an answer built on the numbers and the news.
Show Ask Compass →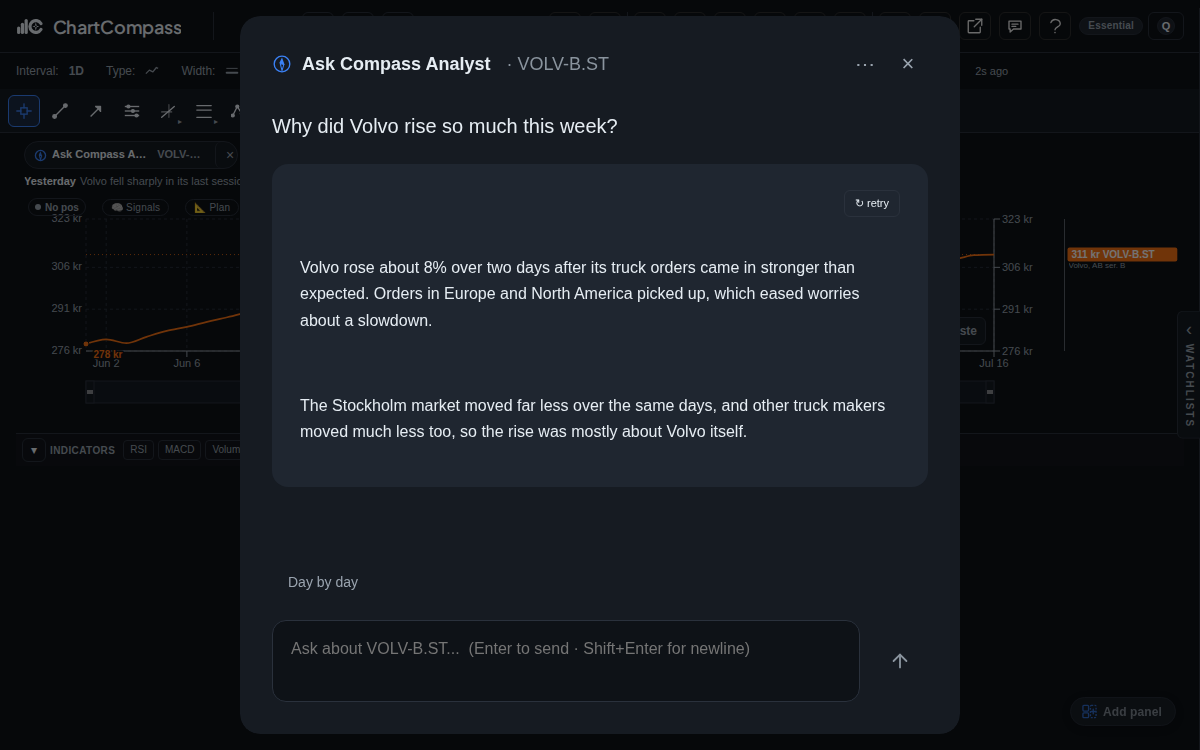
Step 3 of 7
Averages that break, RSI, MACD and new highs are marked right on the chart, so you see what is happening.
Show the chart →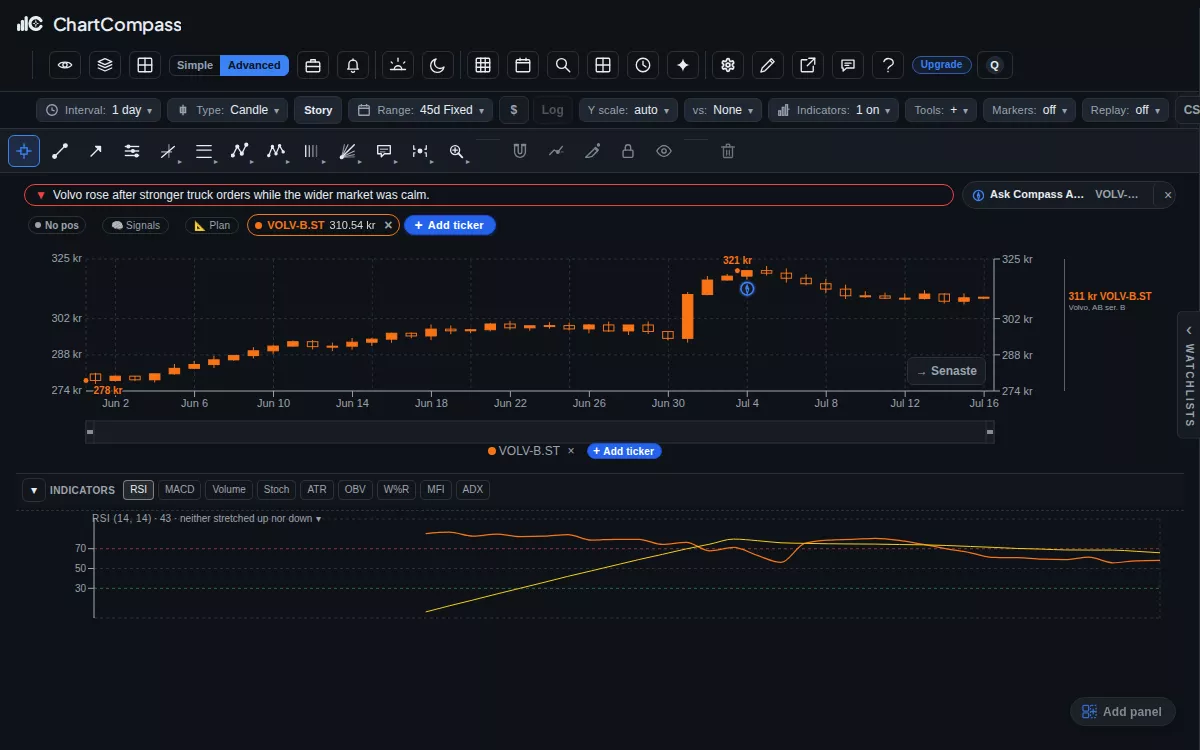
Step 4 of 7
See how the stock moved after similar moments before.
Show the history →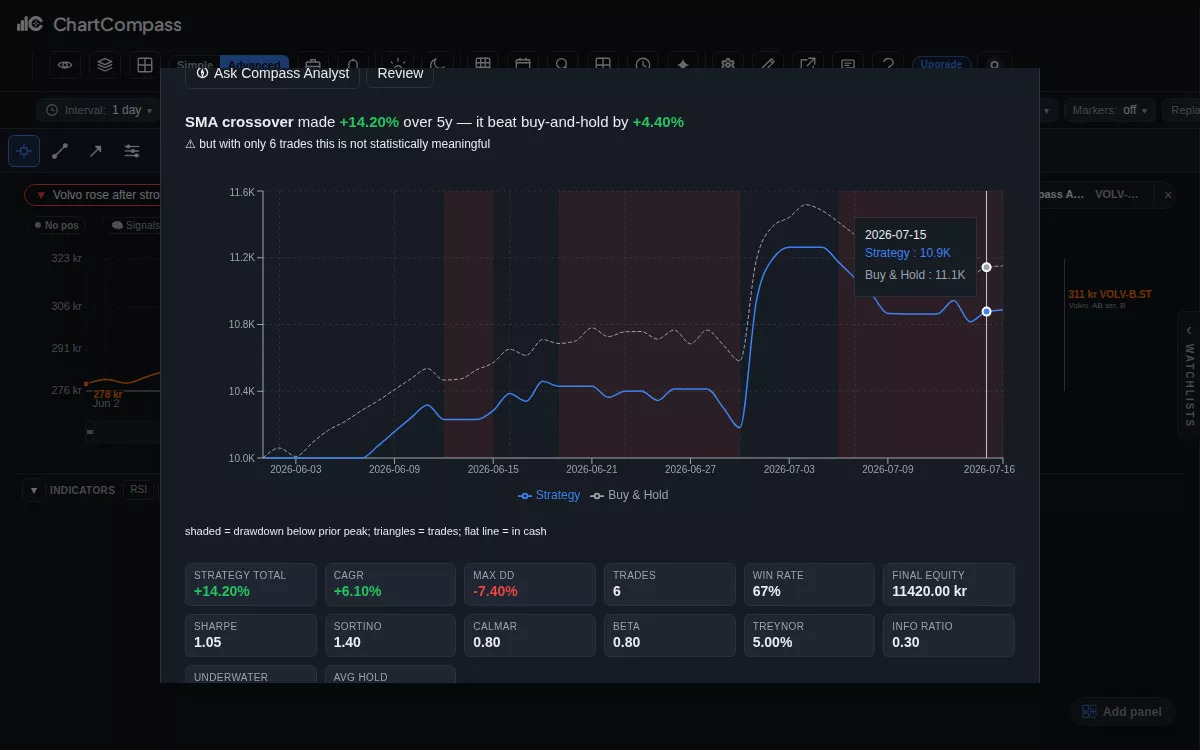
Step 5 of 7
Get a notification when a stock you follow moves a lot or breaks a key level, with the explanation one click away.
Show the alerts →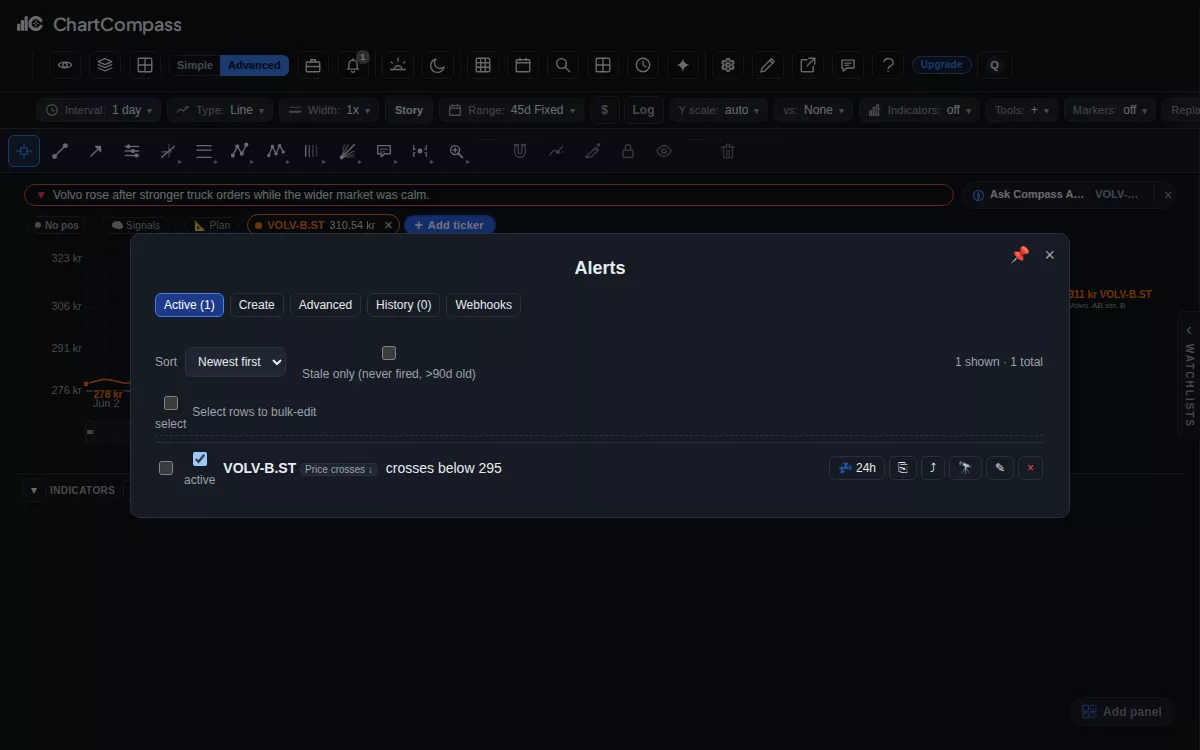
Step 6 of 7
Every Saturday: what was relevant for your stocks this week, and why they moved. Read it in two minutes.
Show the weekly email →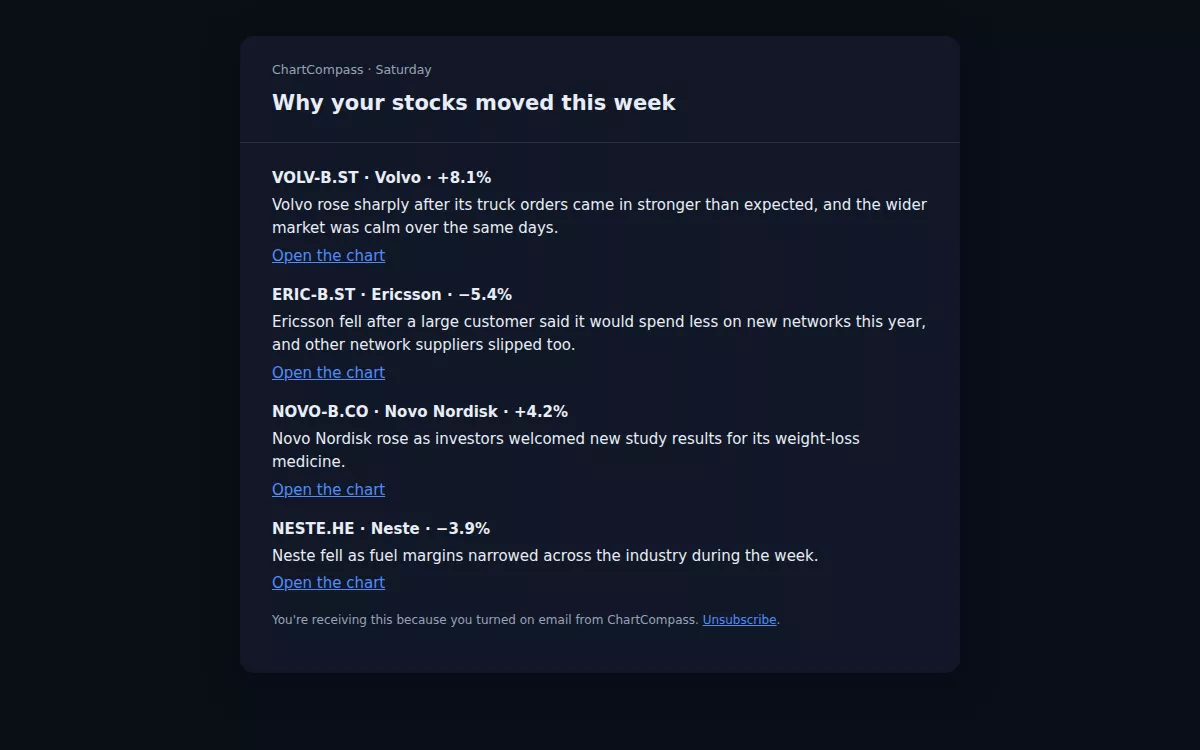
Step 7 of 7
See how your holdings move together and what drove the week, in one view.
Show the portfolio →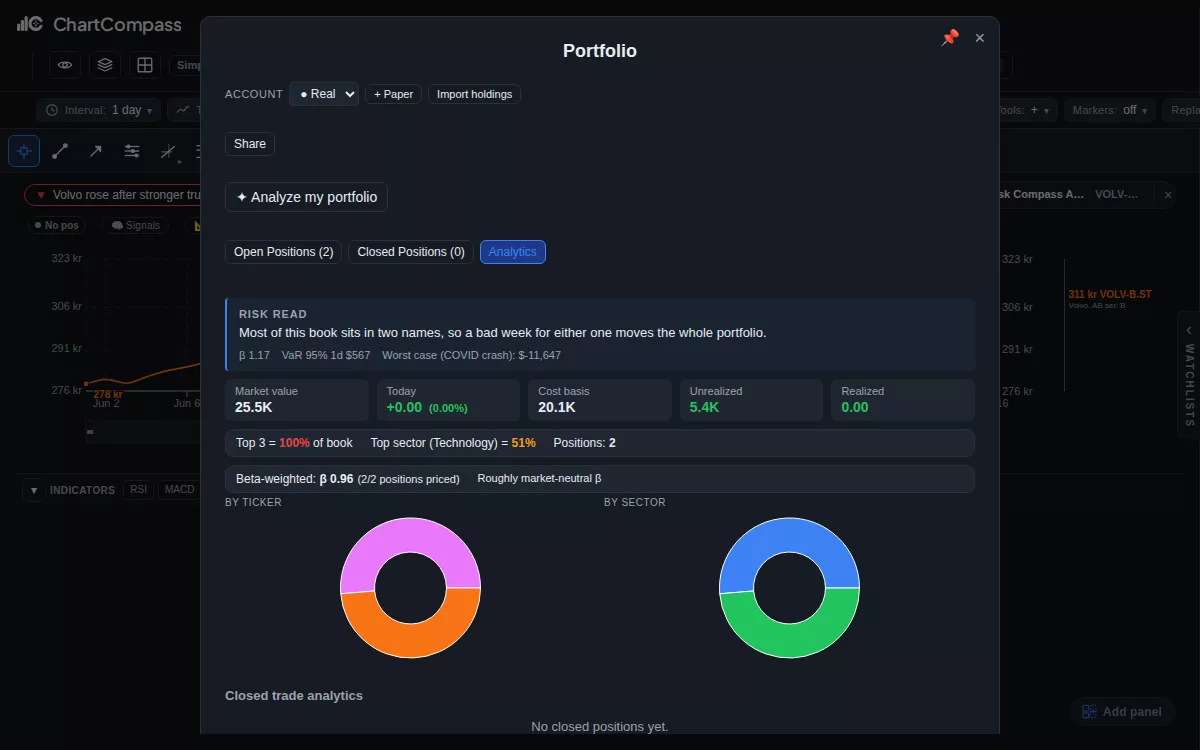
$0
Daily explanations, move explanations on the chart, and the weekly email.
Most popular
$14.95 / month
Ask your own questions and follow-ups, 15 a day.
$34.95 / month
50 questions a day, the daily brief, and a screener for your watchlists.
Everything you have seen above, for your own stocks.
Try it with your stockChartCompass explains market moves. It is not investment advice. Privacy and data handling